Executive Summary
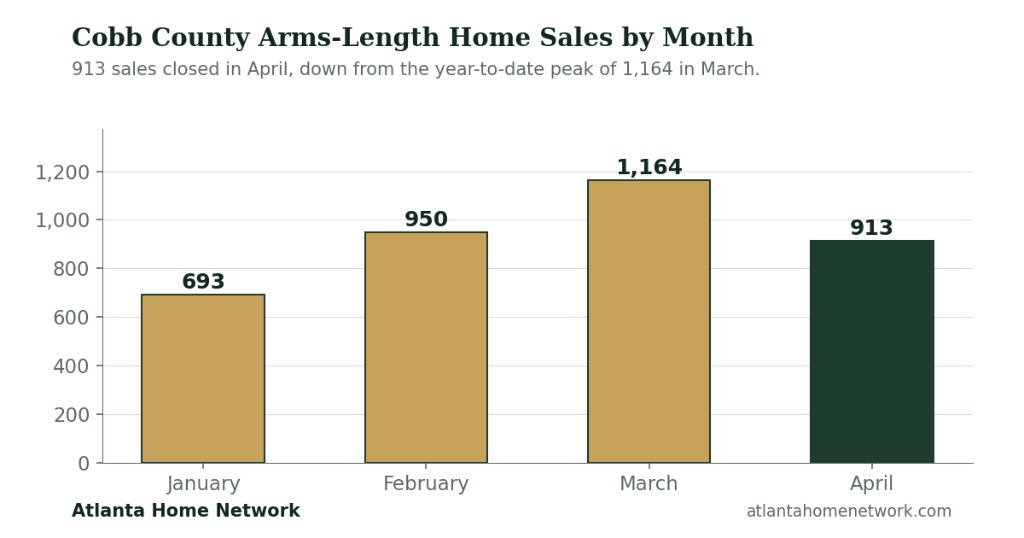
Cobb County recorded 913 open-market home sales in April 2026, according to county property records analyzed by Atlanta Home Network. The median sale price was $434,500 and the average sale price was $520,685. Sales volume was down modestly from March, which closed at 1,164 sales, the strongest month of the year so far. Year to date through April, 3,720 open-market residential transactions have closed in the county at a median price of $424,783.
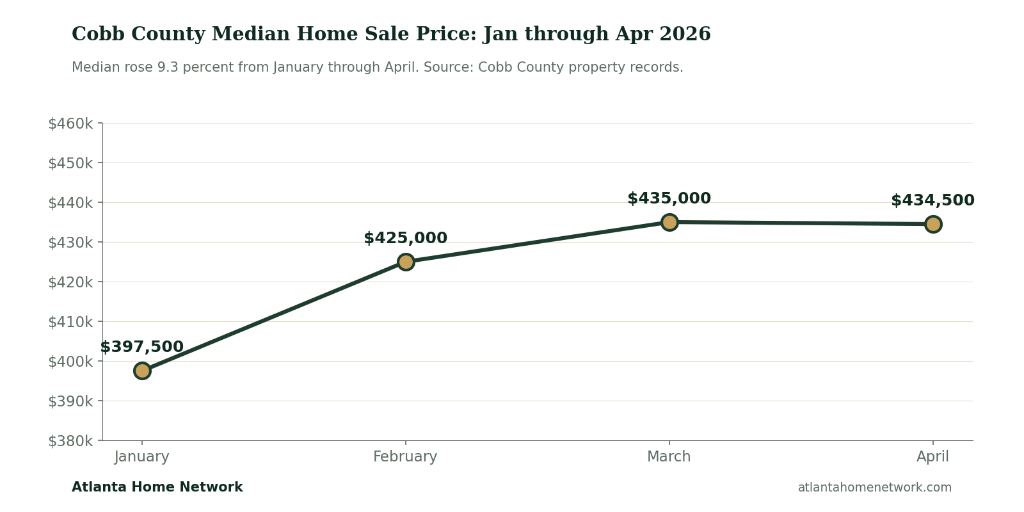
The April data continues a four month pattern of slowly rising median sale prices, with median values climbing from $397,500 in January to $434,500 in April. The price per square foot of $220 in April was unchanged from March and roughly $14 above the January figure.
Key Takeaways
- 913 open-market sales closed in April 2026, down from 1,164 in March but well above the 693 sales recorded in January.
- The median sale price of $434,500 was essentially flat against March ($435,000) and 9.3 percent higher than January.
- Owner-occupied buyers accounted for 61.7 percent of April closings. Likely investor buyers (LLC, corporate, and out of state owners) accounted for 20.8 percent.
- Walton High School zone again led the county in median sale price at $730,000. For a deeper look at Marietta specifically, see our Marietta Q1 2026 Housing Market Report.
- Most expensive single sale of the month: $3,345,000 at 4290 Bakers Farm Place, in the Campbell High zone of unincorporated Cobb. For a deeper look at Smyrna specifically, see our Smyrna Q1 2026 Housing Market Report.
Sales Activity
April produced the second highest monthly sales volume of 2026 to date. The full month by month comparison:
| Month | Open-Market Sales | Median Price | Average Price | Median $/SqFt |
|---|---|---|---|---|
| January 2026 | 693 | $397,500 | $485,672 | $206 |
| February 2026 | 950 | $425,000 | $772,085 | $215 |
| March 2026 | 1,164 | $435,000 | $904,118 | $221 |
| April 2026 | 913 | $434,500 | $520,685 | $220 |
The wide swings in average sale price during February and March reflect a small number of very high value transactions. Atlanta Home Network identified a $58.25 million commercial residential portfolio sale in February and a $14.3 million transaction in March that pulled monthly averages well above their typical range. April's average of $520,685 sits closer to the median, reflecting a month without similar outliers.
April sales broke down by city and unincorporated district as follows:
| Area | April Sales |
|---|---|
| Unincorporated Cobb | 535 |
| Mableton | 85 |
| Marietta | 80 |
| Smyrna | 64 |
| Kennesaw | 56 |
| Powder Springs | 37 |
| Acworth | 30 |
| Austell | 22 |
Unincorporated Cobb accounted for 58.6 percent of April closings. This is consistent with the county's residential geography, where the largest population concentrations sit outside the incorporated city limits.
Median Sale Price
The April median of $434,500 represents the slow upward drift observed across the first four months of 2026. Month over month change was effectively flat at negative $500, or 0.1 percent. The cumulative four month change of $37,000 from January's $397,500 represents a 9.3 percent increase.
Price distribution across April closings:
| Price Band | April Sales | Share of Total |
|---|---|---|
| Under $200,000 | 61 | 6.7% |
| $200,000 to $350,000 | 234 | 25.6% |
| $350,000 to $500,000 | 270 | 29.6% |
| $500,000 to $750,000 | 196 | 21.5% |
| $750,000 to $1 million | 101 | 11.1% |
| Above $1 million | 51 | 5.6% |
The largest single price band, $350,000 to $500,000, captured 29.6 percent of all April closings. Sales above $1 million made up 5.6 percent of activity, in line with February and March levels.
Average Sale Price
April's average sale price of $520,685 sits roughly $86,000 above the April median, reflecting the typical right skew in residential pricing where a relatively small number of high value sales pull the mean above the middle of the distribution.
Compared to March's average of $904,118, April's average dropped substantially. The decline was not driven by a broad market shift but by the absence of the $14 million plus outlier that affected March's calculation. Removing each month's largest sale produces a much more stable trend, with adjusted averages running between $510,000 and $560,000 across all four months.
Price Per Square Foot
The median price per square foot in April was $220, calculated across 860 sales where both price and square footage were recorded in the public record. The month over month and year to date trends:
| Month | Median $/SqFt | Average $/SqFt |
|---|---|---|
| January | $206 | $211 |
| February | $215 | $231 |
| March | $221 | $229 |
| April | $220 | $230 |
The median has risen from $206 to $220 over the four month period, a 6.8 percent increase. Square footage of properties sold has been relatively stable, with April homes averaging 2,201 square feet and a median of 1,986 square feet.
Notable Sales
The ten highest priced residential sales in Cobb County during April 2026:
| Rank | Sale Price | Address | School Zone |
|---|---|---|---|
| 1 | $3,345,000 | 4290 Bakers Farm Place | Campbell High |
| 2 | $3,125,000 | 665 Willow Knoll Drive | Walton High |
| 3 | $2,660,164 | 3760 Creek Stone Way | Walton High |
| 4 | $2,310,000 | 874 Holland Road | Harrison High |
| 5 | $2,250,000 | 2779 Horseshoe Knoll Lane | Pope High |
| 6 | $2,200,000 | 4540 Blackland Drive | Walton High |
| 7 | $2,150,000 | 4211 Blackland Drive | Walton High |
| 8 | $2,100,000 | 590 Ridgewater Drive | Walton High |
| 9 | $2,035,000 | 4683 Magnolia Circle | Walton High |
| 10 | $1,900,000 | 4727 Maple Brook | Walton High |
Eight of the top ten sales were located within the Walton High School attendance zone, an area that consistently produces the highest priced sales in Cobb County. The two top sales outside that zone (Campbell and Harrison High) were both in the high end East Cobb and West Cobb markets that surround Walton geographically.
School District Analysis
Atlanta Home Network's analysis groups Cobb sales by high school attendance zone, the most useful local geographic unit for residential pricing comparisons. Ranking by median sale price for April, only zones with at least five recorded sales:
| School Zone | April Sales | Median Sale Price |
|---|---|---|
| Walton High | 53 | $730,000 |
| Pope High | 46 | $682,500 |
| Lassiter High | 21 | $670,000 |
| Hillgrove High | 45 | $600,000 |
| Harrison High | 40 | $567,500 |
| Wheeler High | 58 | $492,500 |
| Marietta High | 70 | $482,250 |
| Kennesaw Mountain High | 29 | $468,000 |
| Campbell High | 109 | $465,000 |
| Sprayberry High | 71 | $430,000 |
| Allatoona High | 32 | $410,896 |
| Kell High | 31 | $370,000 |
| North Cobb High | 82 | $362,500 |
| Osborne High | 39 | $346,000 |
| Pebblebrook High | 51 | $340,000 |
| McEachern High | 57 | $334,600 |
| South Cobb High | 69 | $330,000 |
The price range between the highest median (Walton at $730,000) and the lowest (South Cobb at $330,000) represents a 2.2 times multiple. This is consistent with multi year patterns in Cobb where Walton, Pope, Lassiter, and Harrison consistently price at the top of the market.
Campbell High recorded the highest sales volume in April at 109 closings, followed by North Cobb at 82 and Marietta at 70. Walton, despite leading on median price, recorded 53 sales, reflecting both lower inventory turnover in established neighborhoods and the smaller geographic footprint of the zone.
Buyer Profile
Owner-occupied buyers accounted for 61.7 percent of April closings. Atlanta Home Network classifies a buyer as owner-occupied when the recorded mailing address matches the property address, indicating the new owner intends to live in the home. Likely investor buyers (entities including LLC, corporate, or out of state owners) accounted for 20.8 percent. The remaining 17.5 percent reflects buyers whose status was ambiguous in the recorded data.
The owner-occupied share in April was approximately 2.6 percentage points higher than the year to date average of 59.1 percent, suggesting the seasonal spring buying pattern continued to favor primary residence purchases over investor activity in April.
Local Commentary
April 2026 looked like a transitional month for the Cobb housing market. Sales volume cooled from March's peak but median pricing held steady, suggesting buyer demand remained strong enough to absorb the inventory without putting downward pressure on prices.
The continued strength of East Cobb pricing, particularly within the Walton and Pope attendance zones, reflects sustained demand for homes in those areas despite the broader rise in mortgage rates over the past year. The price floor in South Cobb, McEachern, and Pebblebrook zones around $330,000 to $340,000 suggests strong baseline demand from first time buyers and from investors targeting the rental market in those areas.
The 20.8 percent investor share in April is notable but not extreme by national standards. National investor purchase rates in early 2026 have been reported in the 18 to 25 percent range for single family homes in metropolitan areas. Cobb's April figure sits in the middle of that range.
What It Means for Homeowners
For Cobb County homeowners considering a sale in the coming months, the April data offers a few useful reference points. Median prices have continued to rise on a per square foot basis throughout 2026, suggesting that homeowners who have not sold since 2024 or earlier likely have meaningful equity gains. The continued strength of pricing in East Cobb and West Cobb school zones means that sellers in those areas can expect competitive offers, particularly in the spring buying window.
For prospective buyers, the breadth of price bands available in April is a useful starting point. With 270 sales in the $350,000 to $500,000 range and another 234 in the $200,000 to $350,000 range, buyers should expect meaningful inventory in the broad middle of the Cobb market.
For homeowners in lower priced zones (South Cobb, McEachern, Pebblebrook), the relatively high investor share suggests active competition from buy-and-hold investors. This may continue to support pricing but could affect the typical homebuying experience in those areas.
City-Level Reports
Atlanta Home Network publishes city-level deep dives alongside this county-wide monthly report:
- Marietta Housing Market Report: Q1 2026, 223 sales, $590,000 median, 39 percent investor share
- Smyrna Housing Market Report: Q1 2026, 225 sales, $485,000 median, 22.7 percent investor share
Additional Cobb city reports for Kennesaw, Acworth, Mableton, Powder Springs, and Austell are scheduled through summer 2026.
This analysis is based on residential property sales recorded in Cobb County public records for the period January 1, 2026 through April 30, 2026, and reviewed by Atlanta Home Network. The dataset includes 6,607 total residential transactions for the period. Atlanta Home Network applied filters to remove private transfers including $0 sales, $1 quitclaim transfers, intra-family transfers, and same day multi-step transactions. After filtering, 3,720 open-market sales remained for the four month period and 913 for the month of April.
Owner-occupied classification was assigned by comparing the recorded mailing address of the new owner against the property address. Investor classification was assigned based on entity name patterns (LLC, INC, CORP, and similar suffixes) and out of state owner mailing addresses.
Square footage and price per square foot calculations exclude properties where square footage was recorded as zero in the source records.
Public county records may lag behind current market activity and may differ from MLS-based reporting. Atlanta Home Network publishes monthly market reports based on public records and reviews the underlying methodology quarterly.
Atlanta Home Network publishes monthly housing market reports for metro Atlanta counties. Cobb County coverage began with the 2025 annual report. Fulton, Gwinnett, Paulding, and Forsyth counties are scheduled for inclusion in the summer 2026 reporting cycle.
Have feedback on this report or want to suggest an analysis topic? Contact us at editor@atlantahomenetwork.com.